
Genogram vs ecomap
This page shows one family twice, as a genogram of Ava Mercer's family across three generations and as an ecomap of the household her mother Alyssa shares with Ava and Caleb, so the difference between the two diagrams is visible on the same people.
Updated October 2026Genogram notation follows McGoldrick et al., Genograms: Assessment and Treatment (4th ed., 2020), and ecomap notation follows Hartman, "Diagrammatic assessment of family relationships" (Social Casework, 1978)
The Mercer family as a genogram and as an ecomap
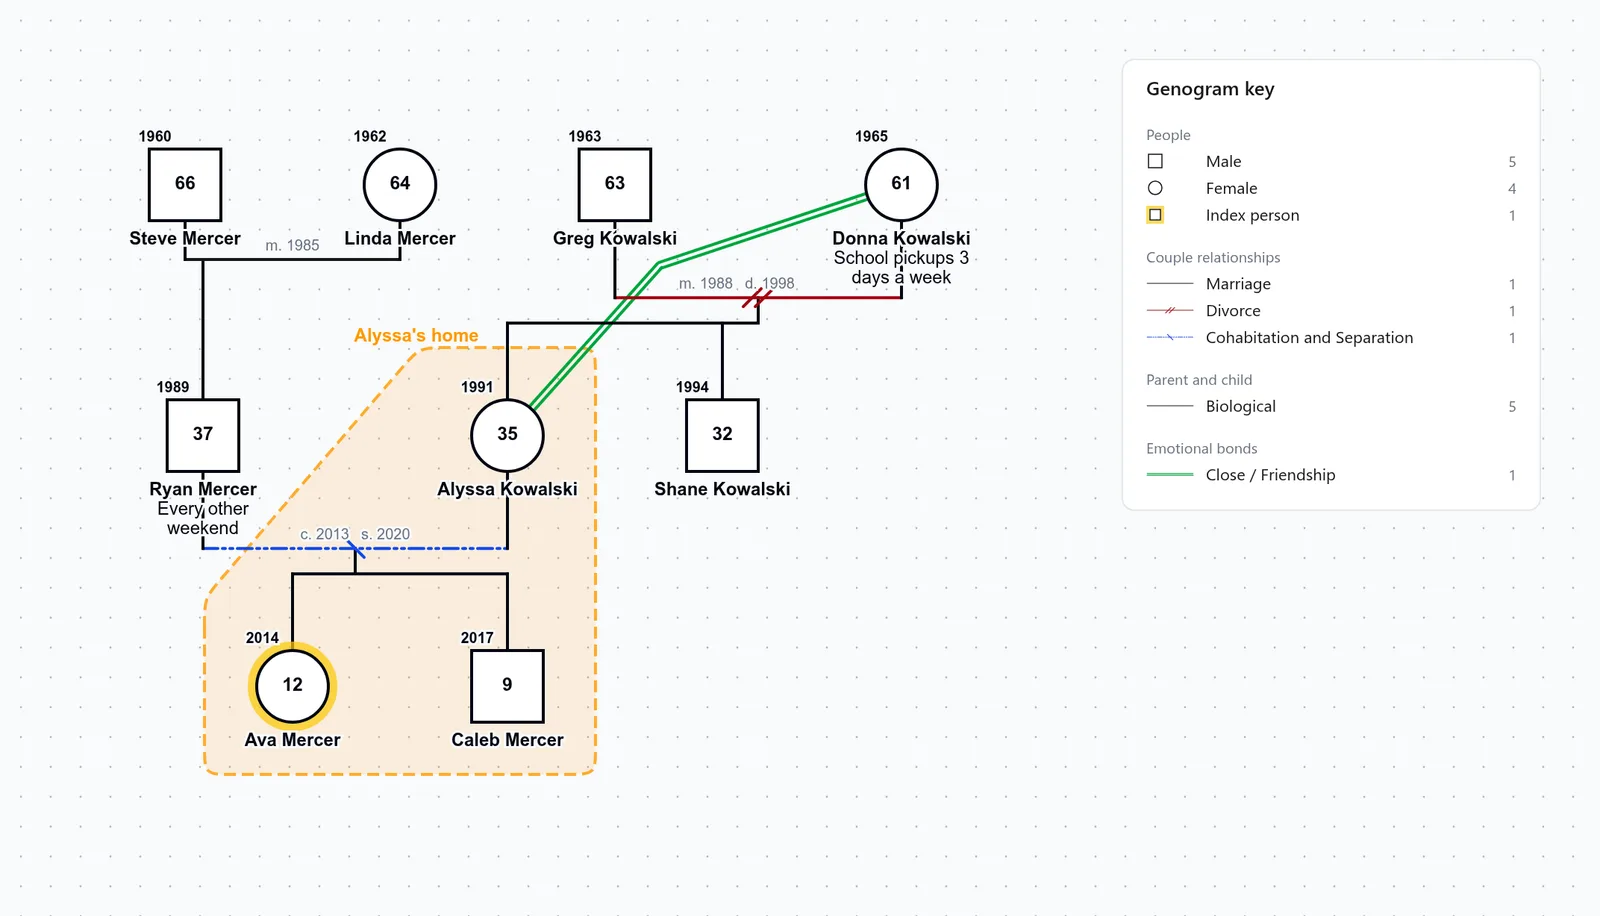
Genogram
Ava, her brother Caleb, their parents and all four grandparents are drawn across three generations, with Ryan and Alyssa's separation on their couple line, Alyssa's home outlined, and Donna's school pickups and Ryan's weekends written under their names.
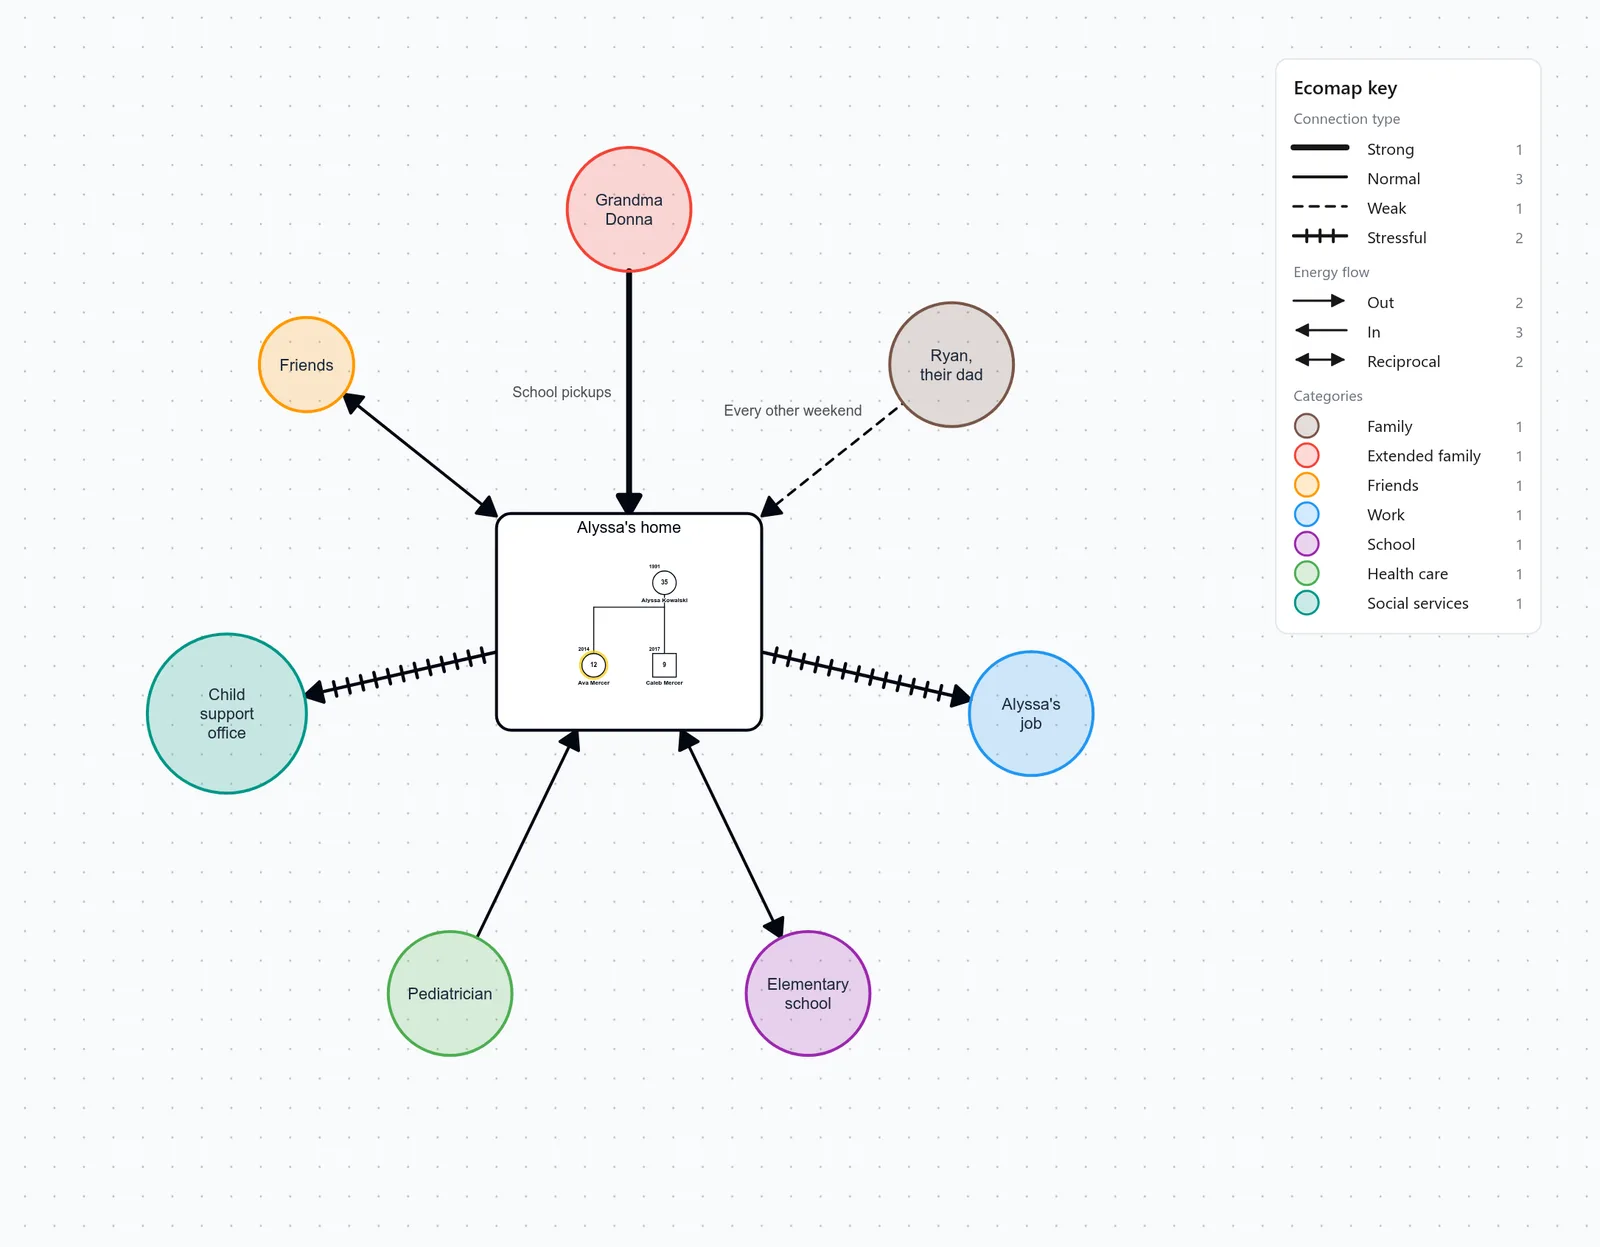
Ecomap
Alyssa's home is at the center, with a line to each person, workplace and service the household deals with now. Alyssa, Ava and Caleb are drawn inside the box because this ecomap is linked to the genogram, and linking is a Professional feature.
How a genogram and an ecomap differ
| Genogram | Ecomap | |
|---|---|---|
| Main question | How is this family related, and what repeats across generations? | Which people and services does this person or household depend on now, and where is the stress? |
| Time | Three or more generations, from grandparents to grandchildren, including people who have died. | The present, at the time the ecomap is drawn. |
| Center | The index person, drawn with a double outline on paper and outlined in yellow in the editor, as Ava is here. | One person or one household, as Alyssa's home is here, with every line drawn from it. |
| What lines mean | Couple lines for marriages and separations, lines from parents to children, and relationship lines such as close or distant between two people. | One line from the center to each system, drawn Strong, Normal, Weak or Stressful, with arrows for the direction of energy. |
| Symbols | A square for a male, a circle for a female, an X for a death, and fills or colors for illness and substance use. | A circle for each system, colored by category, such as Work, School or Health care. |
| Typical use | Family therapy, family systems coursework, and medical and nursing family histories. | Social work intake and assessment, case planning, discharge planning and service coordination. |
When to draw each
Draw a genogram when the family's history matters, such as illness, divorce or conflict that repeats across generations, as in the Bowen family therapy genogram. Draw an ecomap when you need the supports and stresses of a person or household as they are now, for an intake, a case plan or a discharge plan, as in the family ecomap example. When you need both, as in a social work assessment of a family, draw them for the same people.
Draw both for one family
With a Professional plan, you can link an ecomap to its genogram in one file, and a household at the center of the ecomap is then drawn with its family inside, as in Alyssa's home below. In the free genogram maker and the free ecomap maker, each diagram is drawn on its own.
Alyssa's home
The household is the center, with Alyssa, Ava and Caleb drawn inside it as they are on the genogram.
Grandma Donna
A strong line with the arrow pointing in, for the same school pickups that are written under Donna's name on the genogram.
Ryan, their dad
A weak line with the arrow pointing in, for the weekends that are written under Ryan's name on the genogram.
Child support office
A stressful line with the arrow pointing away, drawn only on the ecomap because a genogram has no symbol for an agency.
Questions people ask
What is the difference between an ecomap and a genogram?
A genogram is a diagram of a family across three or more generations, with a symbol for each person, lines for marriages, separations and children, fills for illness, and colored lines for how close or distant people are. An ecomap is a diagram of one person or household as they live now, with the person or household drawn at the center and a circle for each system around them, such as work, school, health care and extended family. Each circle is joined to the center by a line drawn strong, normal, weak or stressful. In the Mercer family on this page, Ryan and Alyssa's separation is drawn on the genogram, and the stress of dealing with the child support office is drawn on the ecomap.
What is an ecomap and genogram?
Both are diagrams that social workers, nurses and family therapists draw in a family assessment. A genogram follows the notation in McGoldrick's Genograms: Assessment and Treatment, and an ecomap follows the notation Ann Hartman set out in 1978 for child welfare work.
Can a genogram and an ecomap be combined?
Yes, with a Professional plan an ecomap can be linked to its genogram in one file, as in the ecomap of Alyssa's home on this page. In the free genogram maker and the free ecomap maker, you draw the two separately.
What do the different lines on an ecomap represent?
A thick line is a strong tie, a plain line a normal one, a dashed line a weak one and a hatched line a stressful one. An arrow pointing to the center is support the person or household receives, an arrow pointing away is energy they give, and arrows at both ends mean energy flowing both ways.
Ecomap examplesDraw your own family both ways
Swap in your own people and systems in the free ecomap maker, or start a 7-day free trial to keep a genogram and its ecomap linked in one file.