
Table of Contents
Basic genogram example: a beginner's guide to reading family maps
A genogram maps who is close to whom, where conflict sits, and which health conditions repeat across generations. A family tree only records names and dates. Learning to read a genogram is the first step toward understanding any family system.
Last updated March 2026 · Based on McGoldrick et al., Genograms: Assessment and Treatment (4th ed., 2020)
This example is designed to illustrate how to create and read genograms. It is not intended as clinical guidance.
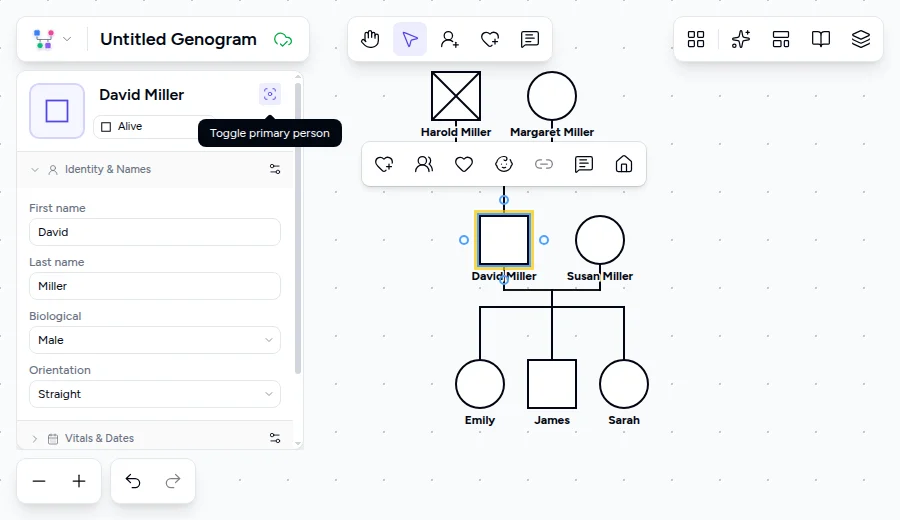
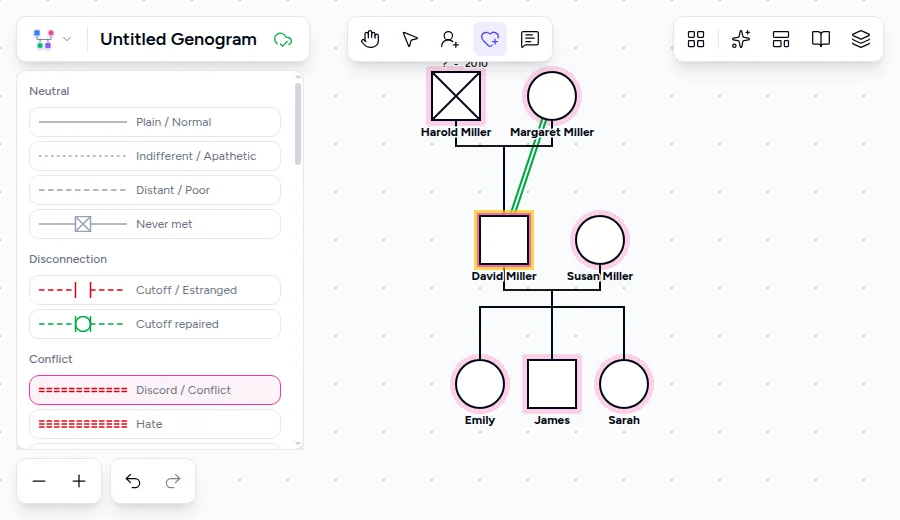
David Miller has a yellow outline around his symbol, marking him as the focus person, the one whose concerns brought this family into view. Follow the lines connecting family members: some are smooth, some are dashed.
Use as TemplatePatterns to look for
The focus person and why it matters
One person on a genogram has a yellow outline around their symbol. This is the identified patient (IP), the family member who presents for treatment or whose situation prompted the assessment. The IP is rarely the sole source of difficulty. They are often the person absorbing stress from elsewhere in the system.
Marking someone as the focus person means they are the starting point for reading the genogram, not that they are the source of the family's problems. From the IP, a clinician reads outward: What pressures converge on this person? What relationship patterns surround them?
Questions to explore:
- Why is this person the one who sought help, rather than another family member?
- If the IP's symptoms resolved tomorrow, where would the tension go?
- What strengths has the family drawn on during past crises?
Reading symbols: squares, circles, and the X
Genogram symbols follow standardized conventions established by Monica McGoldrick and Randy Gerson. Squares represent males. Circles represent females. Diamonds represent non-binary or unknown gender. Triangles represent pregnancies, miscarriages, stillbirths, or abortions. A deceased family member has an X drawn through their symbol.
Once you know that squares are male, circles are female, and X means deceased, you can read any genogram without looking up symbols. A square with an X communicates a deceased male without a single word of explanation. A circle connected to a square by a horizontal line indicates a couple. Children descend from that line, oldest on the left and youngest on the right. The symbols click into place faster once you draw them, so open a free online genogram maker and try placing a couple and their children.
Questions to explore:
- Which family members are deceased, and how recently did the losses occur?
- How has the family reorganized after a death?
- Who in the family has coped well, and what made that possible?
Relationship lines vs. emotional bonds
Genograms use two distinct types of lines. Structural lines (straight, solid) show biological and legal relationships: marriages, parent-child connections, siblings. Emotional bond lines show the quality of the relationship between any two people, drawn using standardized patterns.
A single solid line means a normal relationship. A double line means a close bond. A double dashed line means discord or conflict. A dotted line indicates a distant relationship. A segmented line (broken into pieces with gaps) represents a cutoff, where people have stopped communicating. Genogram Pro includes 39 emotional bond types, including fused, hostile, abuse, love, harmony, friendship, and violence. These emotional bond lines separate a genogram from a family tree.
Emotional bond lines are approximations, not diagnoses. McGoldrick notes that relationship lines are the least reliable part of a genogram because they inevitably oversimplify complex dynamics. Two clinicians assessing the same family may draw different bond types between the same pair of people.
Questions to explore:
- Where are the closest bonds in this family, and are they also the most strained?
- Does the discord between two people affect a third person in the system?
- Which relationships in this family are sources of stability?
Deceased members and unresolved grief
The X through a symbol does more than record a death. The timing and position of a death can reveal unresolved grief patterns that still shape living family members. A death that occurred decades ago may still drive current behavior if grief was never processed. A recent death often reorganizes the entire family structure as alliances shift, responsibilities redistribute, and old conflicts resurface.
When reading a genogram, pay attention to what changed after a death. Did someone step into the deceased person's role? Did a close bond with the deceased leave a gap that was filled by an intensified relationship with someone else?
Questions to explore:
- How old was the IP when this family member died?
- Has the family openly discussed this loss, or is it treated as a closed topic?
- Are there relationships that improved after a difficult period?
Sibling position and birth order
Children on a genogram are arranged left to right from oldest to youngest. This reflects Murray Bowen's observation that birth order influences the roles people assume in families. Oldest children often carry responsibility. Youngest children receive more flexibility. Middle children frequently mediate or feel overlooked.
Sibling position becomes relevant when combined with emotional bond lines. A firstborn connected to the parents by a close bond carries a different clinical picture than a firstborn connected by a distant line. Reading across a sibling row, rather than just reading down through generations, shows how the family distributes attention, responsibility, and stress.
McGoldrick, referencing Toman's work, cautions that birth order patterns are tendencies, not predictions. "Family constellations are not astrology," she writes. Siblings spaced more than six years apart function more like only children than like adjacent siblings.
Questions to explore:
- Does the oldest child carry a disproportionate sense of responsibility?
- Has any child taken on a parental role (parentification)?
- Which sibling relationships are sources of mutual support?
How to build this in Genogram Pro
Read it, then draw it
Open a blank canvas and follow the five steps below to rebuild this family map yourself.
create a genogram online freeStart with the focus person
Click the canvas to place your first person. Enter David Miller's details, then click the focus icon to mark him as the primary person. A yellow outline appears around his symbol.
Add the couple relationship
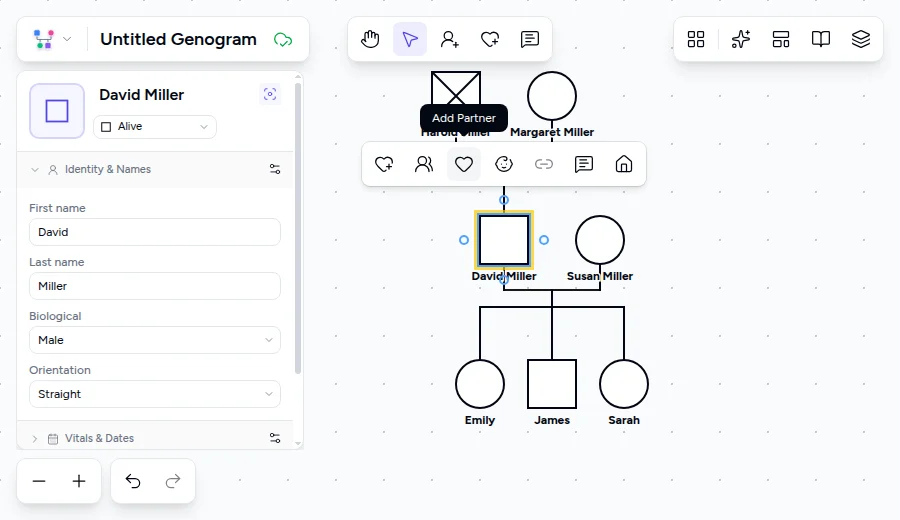
Select David. A toolbar appears above him. Click Add Partner and select "Married" as the relationship type. The horizontal couple line appears between them.
Add children below the couple
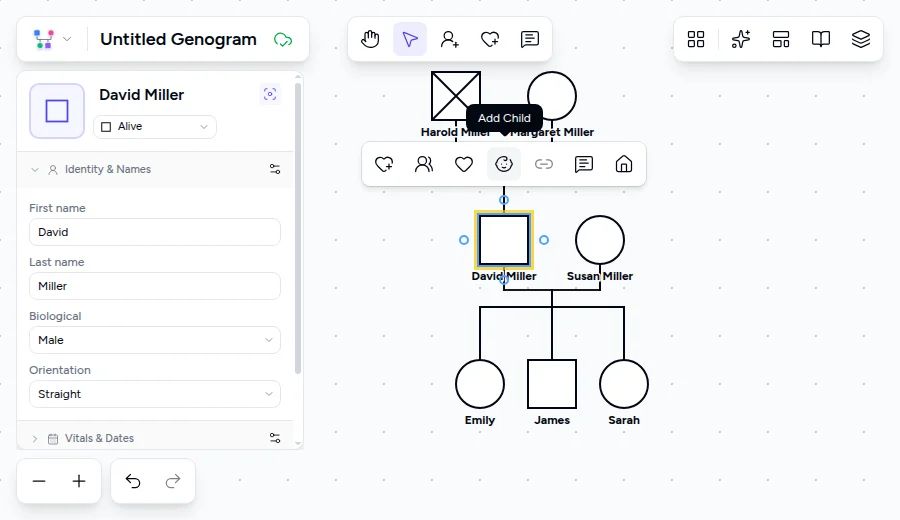
Select a parent, then click Add Child in the toolbar. Add James, Sarah, and Emily. Place children left to right from oldest to youngest.
Build upward to parents
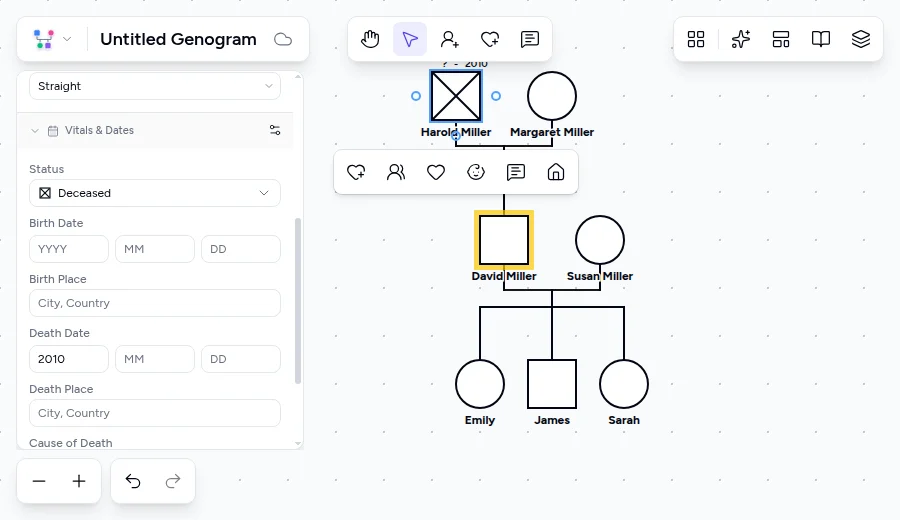
Select David and click Add Parents in the toolbar to place Harold and Margaret above. Mark Harold as deceased and enter 2010 as the year of death. The X appears through his square.
Draw emotional bonds
Select David, then click the Emotional Bond button in the toolbar that appears. Click Margaret to set the target. A bond type picker appears; choose "Close" so the double line appears. Repeat the process: select David, click Emotional Bond, click Susan, and choose "Discord" so the double dashed line appears. These bonds overlay the structural lines, adding the relational layer that makes this a genogram rather than a family tree.
Clinical context
This basic genogram structure reflects the foundational work of McGoldrick and Gerson, whose Genograms: Assessment and Intervention established the standardized symbol system now used across family therapy, social work, nursing, and medicine. The three-generation minimum they recommended ensures that patterns have enough generational depth to identify.
A basic genogram like this one is the first assessment tool used in Bowenian family therapy. Bowen's family systems theory holds that emotional patterns transmit across generations, with anxiety, conflict, closeness, and distance repeating in predictable ways. The genogram makes these repetitions concrete. Even a simple three-generation diagram can show a pattern that might take weeks to surface through conversation alone. A genogram generates hypotheses for further exploration, not conclusions. The patterns it shows are starting points for clinical questions, not diagnostic endpoints.
McGoldrick emphasizes that every genogram assessment should include strengths and resilience alongside problems. Where are the strong bonds? Which family members have coped well? A genogram that maps only dysfunction tells half the story.
Cultural considerations matter from the start. The convention of placing males on the left and females on the right follows Western genogram standards, but clinicians should hold it lightly when working with families whose structures do not follow heteronormative or nuclear family assumptions. You can use diamond symbols for non-binary individuals and flexible relationship types to accommodate diverse family configurations.
Frequently Asked Questions
What does the yellow outline around a person mean on a genogram?
How is a genogram different from a family tree?
Do I need to include three generations?
What if I don't know information about older generations?
What do the different line styles mean at a glance?
Ready to Create Your Own Genogram?
Build professional genograms online with standard notation, AI-powered generation, and end-to-end encryption.