
Table of Contents
Genogram vs. family tree: what a genogram reveals that a family tree cannot
A family tree answers the question "Who am I related to?" A genogram answers the question "What patterns run through my family?" Both map family structure, but only one captures the emotional, medical, and behavioral layers that shape how a family functions. Understanding the difference changes what you can see.
Last updated March 2026 · Based on McGoldrick et al., Genograms: Assessment and Treatment (4th ed., 2020)
This example is designed to illustrate how to create and read genograms. It is not intended as clinical guidance.
This genogram of the Miller family contains information that no family tree could show: the addiction pattern connecting William to his grandson James, the fused bond between Sarah and Emily, and the discord between David and James. Look for the double dashed and triple lines. Those are the layers a family tree omits.
Use as TemplateWhat a family tree captures, and where it stops
A family tree records lineage. It shows who married whom, who their children were, and how generations connect biologically or legally. A well-constructed family tree for the Miller family would show William and Margaret as the grandparents, David and Sarah as their son and daughter-in-law, and James and Emily as grandchildren. It would include birth dates, death dates, and marriage dates. It would be accurate and complete, and almost entirely useless for clinical work.
Family trees were designed for genealogy: tracing ancestry, establishing inheritance lines, and documenting heritage. They answer historical questions well. But they carry no information about how these people related to each other emotionally, what health conditions they had, or what behavioral patterns repeated across generations. A family tree treats every marriage identically. Every parent-child relationship looks the same. There is no visual language for conflict, closeness, or estrangement.
Questions to explore:
- What does the client already know from family tree research that could be enriched with genogram data?
- Has the family ever discussed medical history or emotional patterns, or only lineage?
- What strengths has the family drawn on during past crises?
Turn a family tree into a genogram
Add emotional bonds and conditions to a lineage structure in the free editor.
build one freeRelationship quality: the layer a family tree misses
The most obvious difference between a genogram and a family tree is the emotional bond line. Family trees have one type of line: a connection. Genogram Pro supports 39 bond types, including close, distant, discord, fused, cutoff, and hostile. These lines turn a structural diagram into a relational one.
Relationship quality cannot be inferred from structure. Two couples may both be married for 30 years, but one marriage is characterized by closeness and the other by chronic conflict. A family tree shows these identically. A genogram does not. The discord line between David and James shows a conflicted father-son relationship. The fused bond between Sarah and Emily shows a mother-daughter bond with poor boundaries. These dynamics drive the family's functioning, and a family tree cannot represent them.
Questions to explore:
- Which relationships in the family look stable from the outside but carry significant conflict?
- Where does closeness cross into enmeshment, and how can the client distinguish between them?
- Which relationships in this family are sources of stability?
Medical and behavioral patterns: the hidden inheritance
Family trees occasionally include cause of death for historical figures, but they do not systematically track medical conditions across living family members. Genograms do. By attaching conditions to individuals and viewing the family as a whole, genograms show hereditary risk patterns that no medical chart, focused on a single patient, can show.
The clinical value multiplies when behavioral patterns are tracked alongside medical ones. Addiction, depression, anxiety, eating disorders, and other behavioral health conditions cluster in families. Tracking them on a genogram reveals whether the clustering follows genetic lines, relational lines, or both. A condition that follows the maternal line across three generations carries different implications than one that appears in every eldest child regardless of gender.
Questions to explore:
- Does the medical or behavioral pattern follow a genetic line (all paternal, all maternal) or a relational line (all caretakers, all eldest children)?
- Has the family recognized these patterns, or is the genogram showing them something they have not seen before?
- Who in the family has coped well, and what made that possible?
The addiction pattern that skipped a generation
Intergenerational transmission does not always move in a straight line. A pattern sometimes skips a generation, with a grandparent and grandchild sharing a condition that the parent between them does not carry. This skip-generation pattern is invisible on a family tree and difficult to detect in a traditional intake interview. On a genogram, it is obvious.
Skip-generation patterns involve a combination of genetic vulnerability and relational dynamics. The middle generation, the one that appears unaffected, may have coped by overcontrolling, by avoiding substances entirely, or by channeling the underlying vulnerability into a different behavior. Their child, lacking the same coping structure, may express the original pattern. The genogram does not explain why the pattern skipped, but it makes the skip visible, which prompts the clinical questions that lead to understanding.
Questions to explore:
- How did the middle generation (David) respond to the grandparent's (William's) addiction?
- Is the third generation aware of the grandparent's history, or is it a family secret?
- Which family members broke a negative pattern, and what made that possible?
The fused bond the family tree cannot show
Enmeshment (a relationship with poor emotional boundaries where one person's feelings, decisions, and identity are excessively entangled with another's) is one of the most clinically important patterns in family systems work. It cannot be represented on a family tree. A family tree shows a mother and daughter as connected. A genogram shows whether that connection is healthy closeness, enmeshment, or something else entirely.
Enmeshment develops as a response to other dysfunction in the system. When one relationship is conflicted (David and James), another may compensate by becoming excessively close (Sarah and Emily). The genogram makes this compensatory pattern visible by placing both dynamics on the same map. The conflict and the enmeshment are not separate issues. They are two sides of the same system.
Questions to explore:
- Does the fused relationship serve a protective function, and if so, what is it protecting against?
- How does the conflict between David and James affect Sarah and Emily, and vice versa?
- Are there relationships that improved after a difficult period?
How to build this in Genogram Pro
Build the family tree structure first
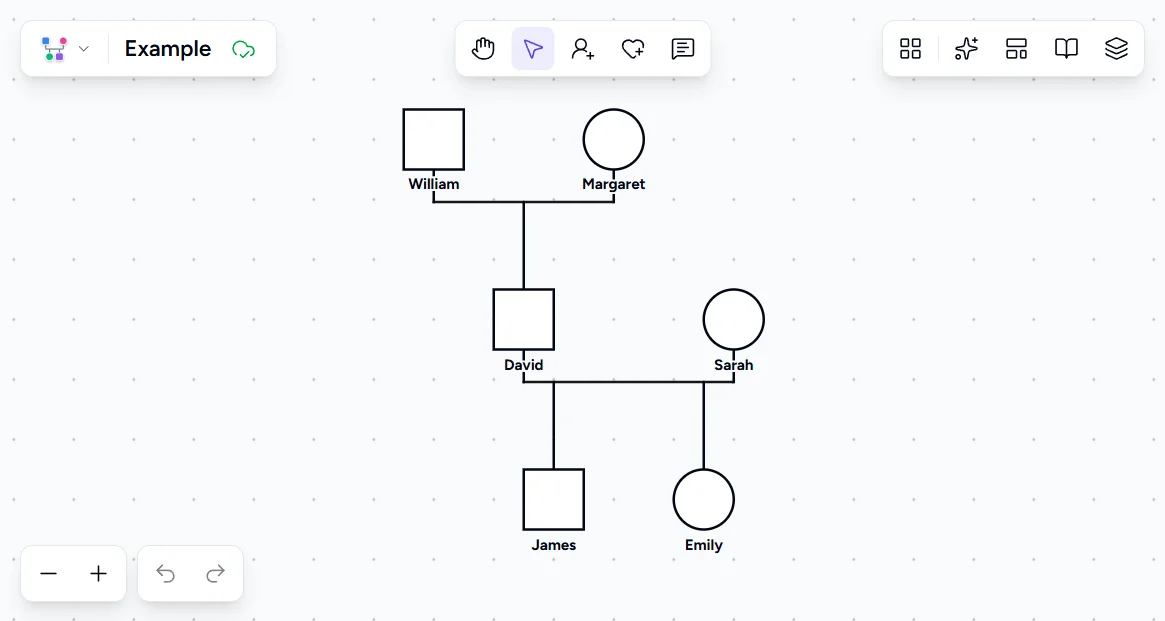
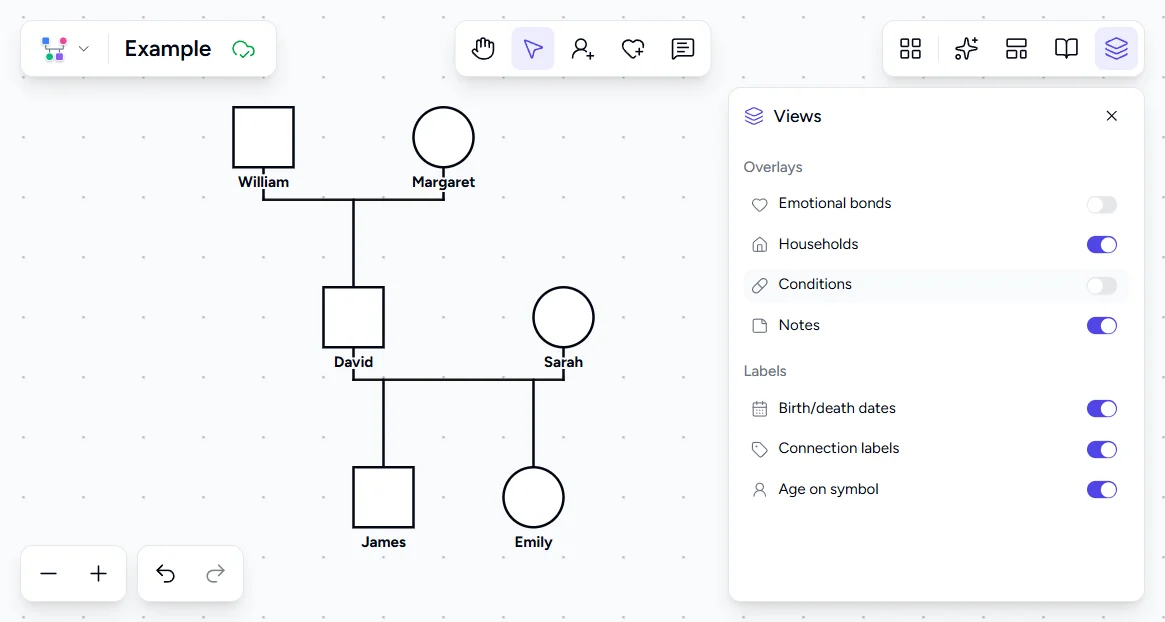
Start with William and Margaret in the grandparent row. Add David and Sarah as a couple below. Add James and Emily as children. At this stage, the genogram looks identical to a family tree: only structural lines are present.
Add medical and behavioral conditions
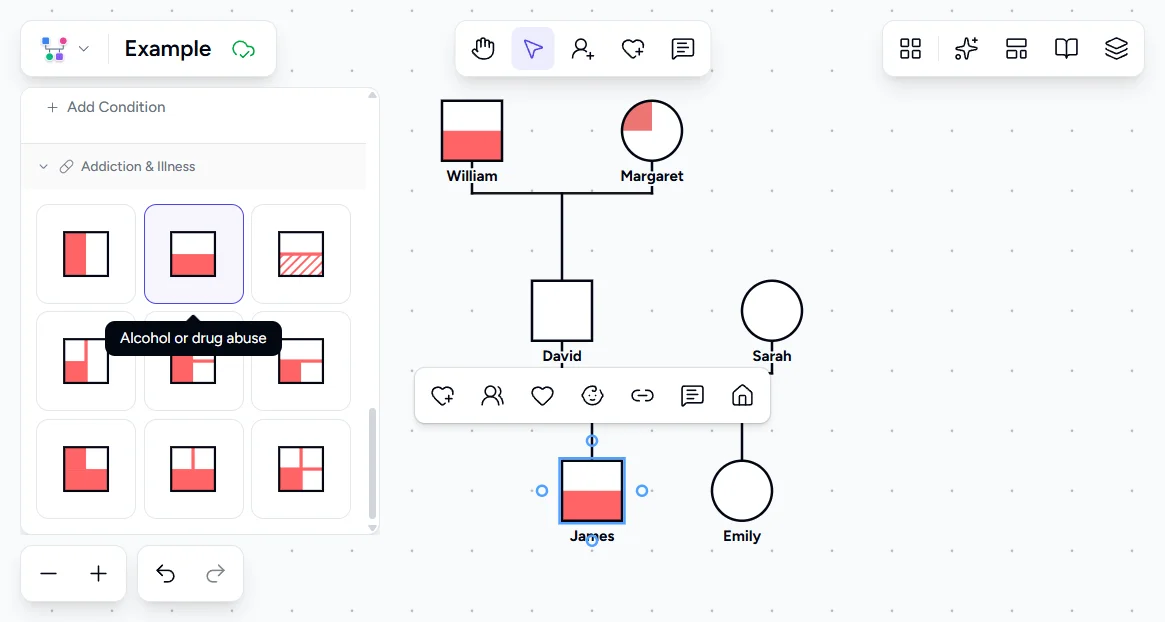
Attach addiction to William. Attach cardiovascular disease to Margaret. Attach addiction to James and depression to Emily. Choose a distinct color for each condition type. The hereditary patterns become visible.
Draw the discord line
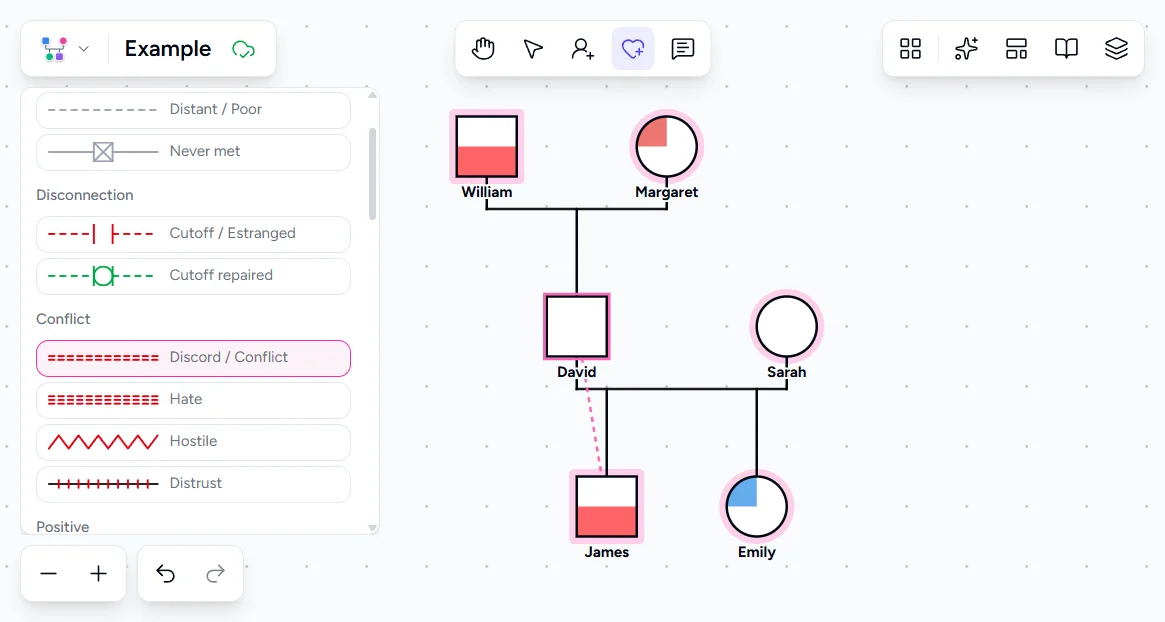
Select David, click the Emotional Bond button in the toolbar, then click James. In the bond type picker, choose "Discord." The double dashed line appears between them, overlaying the structural parent-child line. This is the first layer that distinguishes the genogram from a family tree.
Draw the fused bond
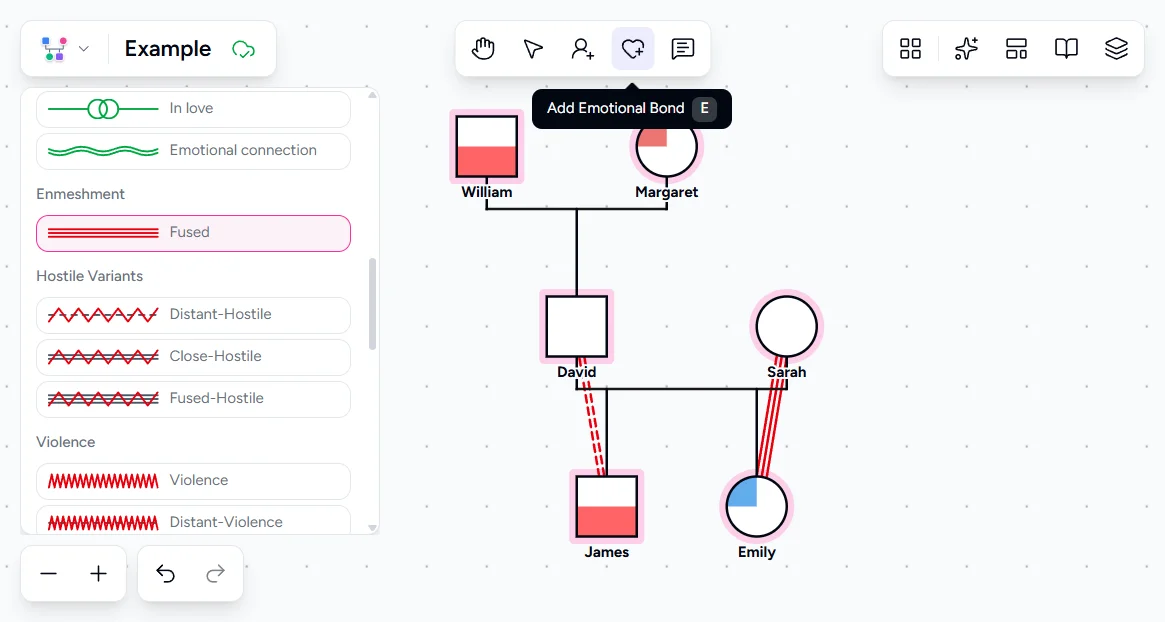
Select Sarah, click the Emotional Bond button in the toolbar, then click Emily. Choose "Fused." The triple line appears, indicating a bond with poor emotional boundaries. Now the two competing dynamics, father-son discord and mother-daughter enmeshment, are both visible on the same map.
Compare the two views
Open the Views panel in the right sidebar and turn off Emotional Bonds and Conditions to see the structure-only view, leaving just the family tree. Then toggle them back on for the full genogram view. The contrast shows exactly what a genogram adds to a family tree.
Clinical context
The distinction between genograms and family trees reflects a broader shift in how families are understood clinically. Genealogy asks who. Family systems theory asks how. A family tree is a record. A genogram is an assessment tool. Both have value, but they serve different purposes.
McGoldrick and Gerson positioned the genogram as an expansion of the family tree, retaining its structural clarity while adding the relational, medical, and behavioral layers necessary for clinical work. A genogram generates hypotheses for further exploration, not conclusions. The patterns it shows are starting points for clinical questions, not diagnostic endpoints.
Many clients arrive with family tree knowledge but no genogram awareness. They may know their great-grandparents' names and immigration dates but have never considered what emotional patterns those ancestors carried. Introducing the genogram as "a family tree with feelings" oversimplifies the tool, but it resonates with clients encountering it for the first time. The clinical work begins when the client sees something on the genogram that the family tree never showed them.
Frequently Asked Questions
Can I convert a family tree into a genogram?
Is a genogram always better than a family tree?
My client brought a family tree to the session. Should I use it?
Does the skip-generation pattern mean the middle generation is unaffected?
Ready to Create Your Own Genogram?
Build professional genograms online with standard notation, AI-powered generation, and end-to-end encryption.