
Table of Contents
Medical genogram: mapping hereditary cancer risk across generations
When two or more first-degree relatives develop the same cancer, or cancers that cluster along known genetic pathways, coincidence becomes a pattern worth investigating. A medical genogram turns scattered family health conversations into a structured visual map of hereditary cancer risk. It shows which branch of the family carries the pattern, at what age cancers appeared, and whether the clustering suggests a syndrome like BRCA-associated hereditary breast-ovarian cancer or Lynch syndrome.
Last updated March 2026 · Based on McGoldrick et al., Genograms: Assessment and Treatment (4th ed., 2020)
This example is designed to illustrate how to create and read genograms. It is not intended as clinical guidance.
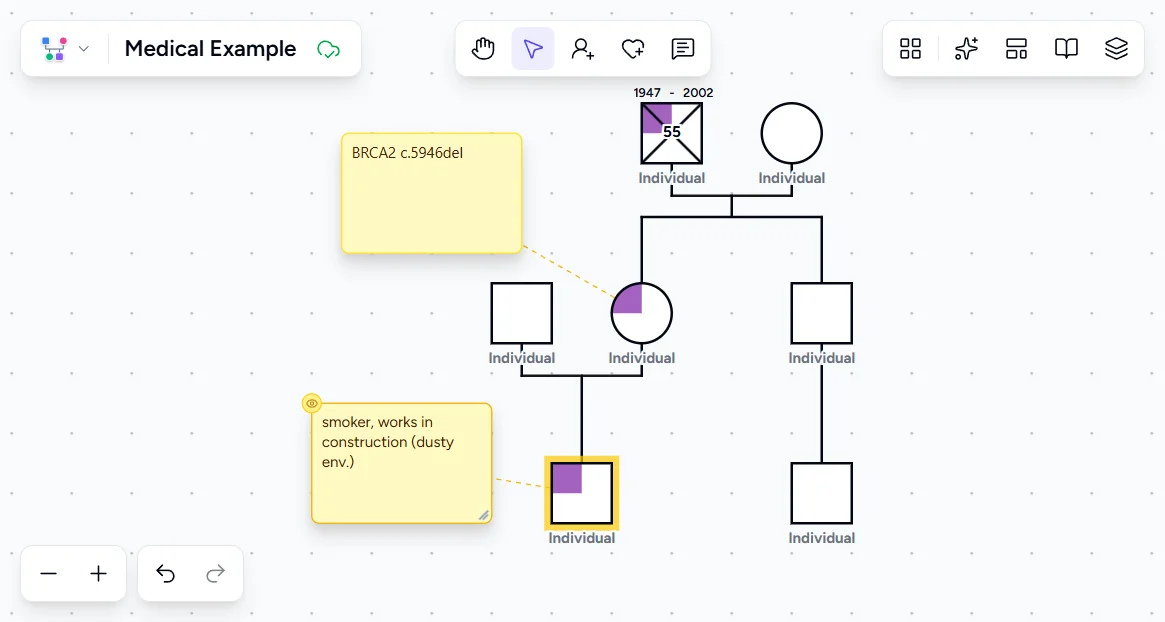
Examine the three-generation cancer distribution. Notice which cancers appear on the same lineage and the ages at diagnosis. Earlier onset signals higher hereditary concern.
Use as TemplatePatterns to look for
Cancer site clustering along genetic pathways
Not all familial cancers point to the same underlying risk. Hereditary cancer syndromes produce distinctive clusters of cancer types. BRCA1 and BRCA2 pathogenic variants are associated with breast, ovarian, prostate, and pancreatic cancers on the same lineage. Lynch syndrome, caused by mismatch repair gene mutations, clusters colorectal and endometrial cancers, sometimes alongside ovarian, gastric, and urinary tract cancers. Recognizing which cancers appear together is the first step in deciding whether a family history warrants genetic counseling referral.
On a genogram, this means looking not just at whether "cancer" appears multiple times, but at the specific cancer sites. A family with breast cancer and ovarian cancer in the same lineage tells a different genetic story than a family with colorectal cancer and endometrial cancer. The cancer types, not just the count, determine the clinical pathway.
Questions to explore:
- Which cancer types cluster together, and do they map to a known hereditary syndrome (BRCA, Lynch, Li-Fraumeni)?
- Are cancers appearing on one side of the family or both? Single-lineage clustering increases the likelihood of an inherited variant.
- Has anyone in this lineage already undergone genetic testing, and are those results documented?
- Which family members have proactively pursued screening or risk-reducing strategies, and what enabled their access?
Chart your own cancer history
Add diagnoses and onset ages across each lineage to see where the risk clusters.
open the free genogram makerAge-of-onset patterns as diagnostic markers
Cancer diagnosed before age 50 is one of the strongest indicators of hereditary risk. NICE familial breast cancer guidelines flag early-onset breast cancer, particularly under age 40, as a trigger for referral to specialist genetic services. Lynch syndrome criteria similarly weight early-onset colorectal cancer as a primary red flag. On a genogram, recording age at diagnosis next to each cancer is essential. A breast cancer diagnosis at age 38 carries different clinical weight than the same diagnosis at age 72.
Age-of-onset patterns also show acceleration across generations. When a grandparent developed cancer at 55 and a parent at 43, the downward trend suggests genetic anticipation or increased environmental exposure. Both are worth investigating. Genograms make this temporal pattern visible by placing diagnosis ages alongside each affected individual.
Questions to explore:
- Are any cancers diagnosed before age 50? Before age 40?
- Is the age of onset getting younger across generations?
- Do the early-onset cases meet referral thresholds outlined in NICE CG164 or Amsterdam II criteria for Lynch syndrome?
- Have any family members survived early-onset cancers, and what factors (early detection, screening adherence, treatment access) contributed to their outcomes?
First-degree relative density
The number of affected first-degree relatives (parents, siblings, children) remains the most accessible risk indicator in primary care. Two or more first-degree relatives with the same cancer type, or cancers within a known hereditary cluster, constitutes a pattern that warrants further assessment. This threshold appears across multiple clinical guidelines, including NICE recommendations for familial breast cancer and CDC guidance on Lynch syndrome screening eligibility.
On a genogram, first-degree relative density is visible at a glance. Count the affected individuals who are directly connected to the patient by a single generational line. Second-degree relatives (grandparents, aunts, uncles) add context but carry less statistical weight individually. However, a dense second-degree history on one lineage can be just as informative, especially when first-degree relatives died young from other causes or when the family is small.
Questions to explore:
- How many first-degree relatives of the focus person have a cancer diagnosis?
- Are there unaffected first-degree relatives who should be flagged for screening based on the density of affected relatives around them?
- Is the family size large enough for the pattern to be statistically meaningful, or could a small family mask a higher risk?
- What protective factors exist among unaffected family members in high-risk lineages?
Mapping conditions and genetic test results
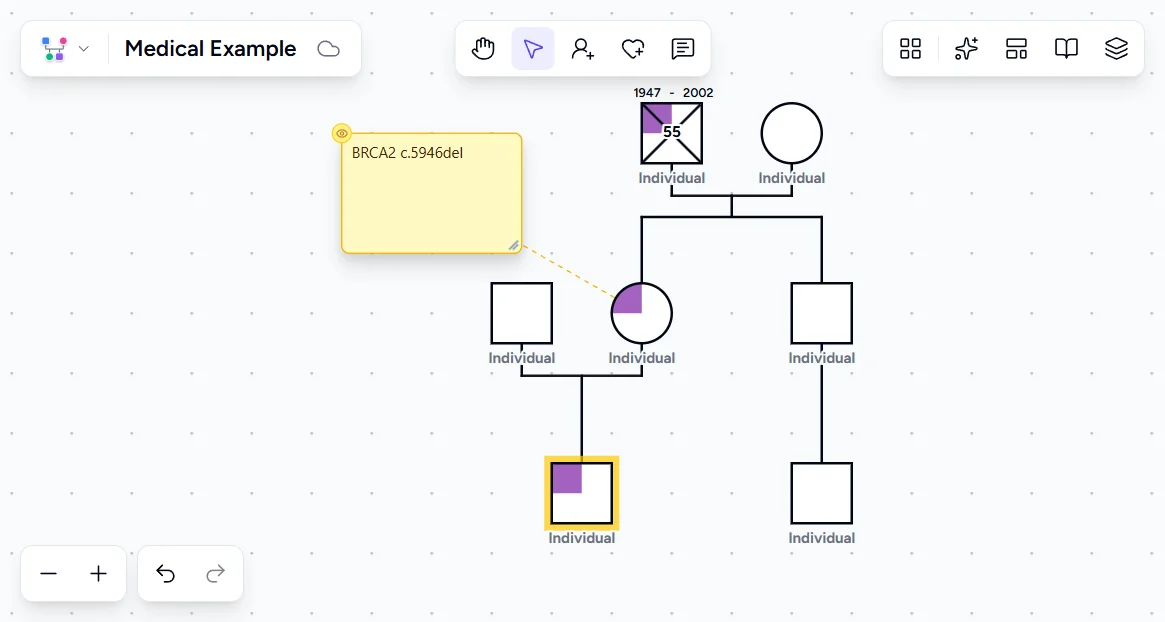
Hereditary cancer risk does not require every gene carrier to develop cancer. Individuals who carry a known pathogenic variant but have not developed cancer are critical to document. In Genogram Pro, conditions display as color-coded fills on the symbol. You can record genetic test results and carrier status in notes attached to each person, including the specific variant identified (e.g., BRCA2 c.5946del) and the testing laboratory.
Documenting these results on a genogram turns the diagram from a record of illness into a map of risk transmission. A family member tested and found to carry a BRCA2 variant but currently cancer-free is not "unaffected" from a genetic counseling perspective. They are a confirmed link in the transmission chain. A family member tested negative for the familial variant can be removed from the high-risk surveillance pathway, reducing unnecessary screening and anxiety.
Questions to explore:
- Have any unaffected family members undergone predictive genetic testing?
- Are there family members in a risk lineage who have not been tested and should be offered counseling?
- How has the family responded to genetic information, and what support systems have they drawn on?
Environmental vs. hereditary distinction
Not every cancer on a genogram reflects inherited risk. Environmental and behavioral factors, such as smoking, occupational exposures, and diet, produce cancers that cluster in families through shared lifestyle rather than shared genetics. A genogram should include notes about known environmental exposures alongside diagnoses to help clinicians distinguish hereditary patterns from environmental ones.
The clinical distinction matters for intervention planning. Hereditary risk leads to genetic counseling referral, predictive testing, and enhanced surveillance protocols. Environmental clustering leads to lifestyle modification counseling and exposure reduction. Some cases involve both: a family with hereditary susceptibility and high smoking rates faces compounded risk that neither factor alone would predict.
Questions to explore:
- Are there documented environmental exposures (tobacco, occupational carcinogens) that could account for some of the cancer clustering?
- Does removing environmentally attributable cancers still leave a hereditary pattern?
- Are family members aware of the distinction between inherited and environmental risk factors?
- Have any family members made lifestyle changes that reduced environmental risk, and what motivated those changes?
How to build this in Genogram Pro
Start with the patient and build outward by lineage
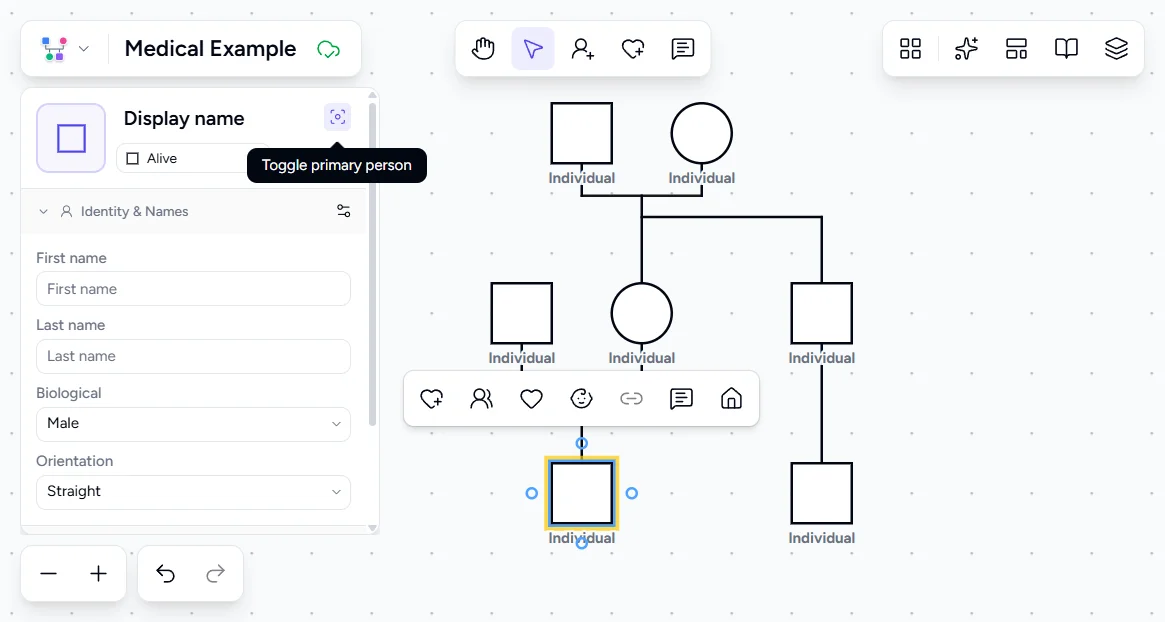
Place the focus person at the center. They will display a yellow outline. Add parents, then grandparents, then aunts and uncles on each side separately. In a medical genogram, maintaining clear lineage separation matters: paternal cancers and maternal cancers may point to entirely different syndromes.
Add medical conditions with age of onset
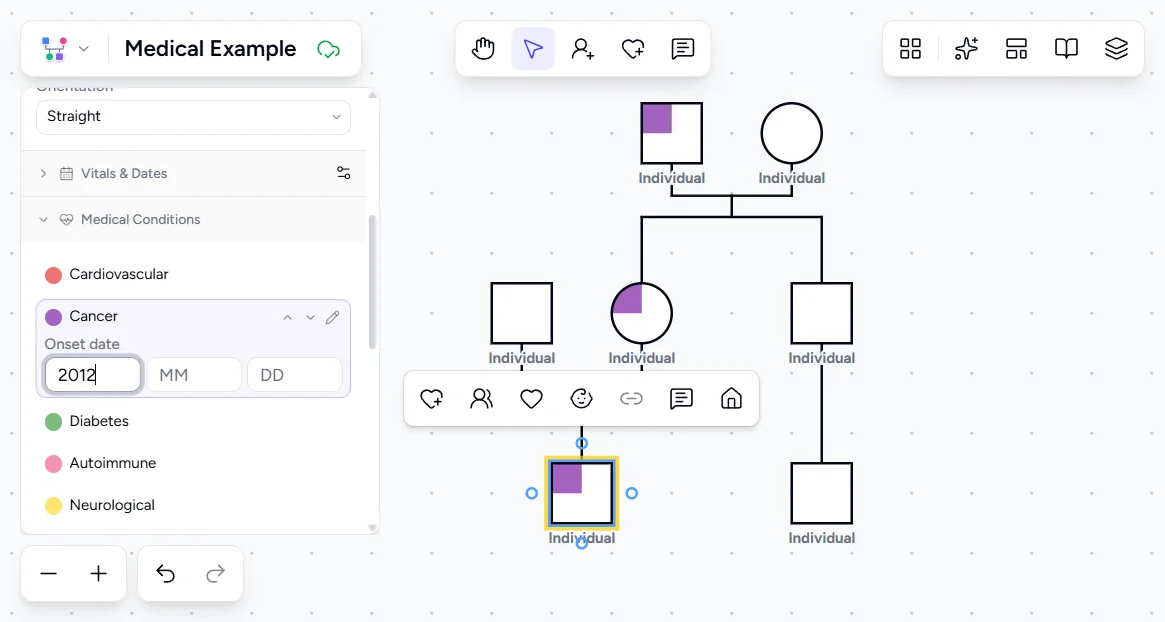
For each family member with a cancer diagnosis, add the cancer type as a medical condition. Use a preset like Cancer or add a custom condition with the specific type. Be precise: "breast cancer, dx age 42" is clinically useful; "cancer" is not.
Mark deceased members with cause and age of death
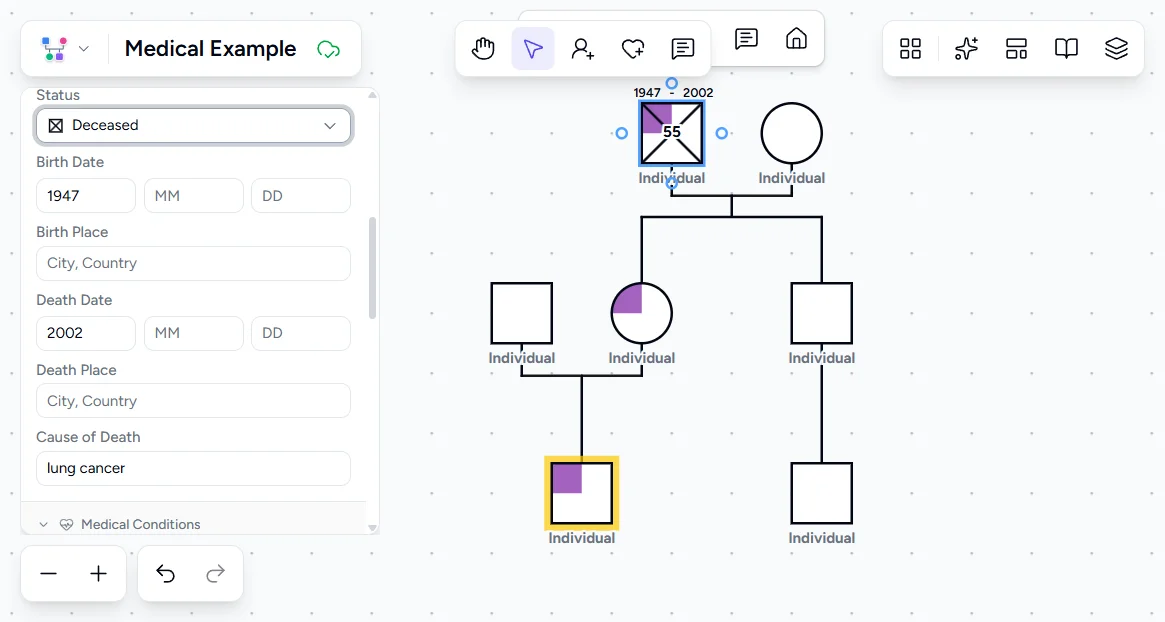
Click any individual and mark them as deceased. An X will appear through their symbol. Enter the cause of death in the Cause of Death field and add the death date. This information is needed for hereditary cancer assessment. A relative who died at 35 in a car accident cannot be counted as "unaffected," because they did not live long enough to develop a late-onset cancer.
Annotate genetic test results
For family members who have undergone genetic testing, select the person and click the Note button in the selection toolbar. Document the specific variant identified (e.g., BRCA2 c.5946del), the testing laboratory, and whether the result was positive or negative. This annotation makes the genogram a living genetic record.
Add environmental exposure annotations
Select a person and click the Note button in the selection toolbar to attach smoking history, occupational exposures, or other environmental risk factors alongside medical conditions. This creates a complete risk profile that distinguishes hereditary from environmental clustering.
Clinical context
Medical genograms for hereditary cancer assessment sit at the intersection of family medicine, genetic counseling, and oncology. NICE guideline CG164 on familial breast cancer provides structured criteria for when family history should trigger referral from primary care to specialist genetic services. These criteria map directly onto what a well-constructed genogram shows. The WHO has emphasized family health history as a foundational tool for identifying individuals at increased risk of chronic diseases, including hereditary cancers. The CDC recommends systematic family health history collection as part of routine primary care to identify candidates for genetic counseling and enhanced screening.
The genogram's advantage over a text-based family history is pattern visibility. A written note stating "mother had breast cancer at 45, maternal grandmother had ovarian cancer at 52, maternal aunt had breast cancer at 48" contains the same information as a genogram. But the genogram makes lineage-specific clustering, age-of-onset patterns, and cancer-site specificity visible at a glance. For genetic counselors, this visual format accelerates risk assessment. For primary care clinicians, it reduces the likelihood of missing a referral-worthy pattern buried in text notes.
A family cluster of a condition does not automatically mean genetic inheritance. Shared environment, lifestyle, and exposure can produce similar clusters. Kaakinen notes that nurses "should not assume that a condition is genetic merely because more than one family member has it." The genogram raises hypotheses about heritability that require genetic counseling and testing to confirm.
Cultural considerations apply. Some families have limited knowledge of ancestral health history due to migration, family disruption, or cultural norms around discussing illness. Small family size can mask hereditary patterns: a family with only one female relative per generation may carry a BRCA variant without showing the typical multi-case pattern. Clinicians should note family size and information gaps on the genogram to avoid false reassurance from an apparently "clean" history.
Frequently Asked Questions
How many relatives with cancer make a family history "significant"?
Should environmental cancers be included on a hereditary cancer genogram?
How do I represent genetic test results on a medical genogram?
When should a primary care clinician refer based on a genogram?
Ready to Create Your Own Genogram?
Build professional genograms online with standard notation, AI-powered generation, and end-to-end encryption.