
Table of Contents
Example of a genogram: what it is and how to read one
A genogram maps who is close to whom, where conflict sits, and which health conditions repeat across generations. A family tree records names and dates. A genogram adds relationship quality, emotional bonds, and medical history on top of that structure. Doctors, therapists, social workers, and counselors use genograms to read a family's dynamics at a glance. This page walks you through how to read one.
Last updated March 2026 · Based on McGoldrick et al., Genograms: Assessment and Treatment (4th ed., 2020)
This example is designed to illustrate how to create and read genograms. It is not intended as clinical guidance.
Three generations of a family: grandparents at the top, parents in the middle, children at the bottom. Each shape is a person. Lines between them show legal connections (marriage, parent-child) and emotional bonds (close, conflicted, distant).
Use as TemplatePatterns to look for
What the shapes mean
Every person on a genogram is a shape. Squares are male. Circles are female. Diamonds represent someone whose gender is non-binary, other, or unknown. A triangle represents a pregnancy, miscarriage, stillbirth, or abortion.
If a shape has an X drawn through it, that person has died. A square with an X is a deceased male. A circle with an X is a deceased female.
One shape on a genogram has a yellow outline around it. This marks the "focus person" (also called the identified patient), the person whose situation prompted the genogram. It does not mean this person is to blame for anything. Marking someone as the focus person means they are the starting point for reading the genogram, not that they are the source of the family's problems.
Questions to explore:
- Can you identify each person's gender from their shape?
- Which family members are deceased?
- Which person is the focus person?
- What strengths or resources does the focus person draw on?
See the symbols in action
Place a few shapes and connect them to learn how a genogram reads at a glance.
build one in the free makerWhat the lines mean
Lines connect people, but different lines mean different things. A straight horizontal line between two people indicates a couple (married or partnered). Vertical lines drop from a couple to their children. These are structural lines and work the same way as a standard family tree.
What makes a genogram distinct are the emotional bond lines. These use different visual styles to show relationship quality. A double line means closeness. A double dashed line means conflict. A dotted line means distance, a connection that exists on paper but not emotionally. A segmented line (broken into pieces with gaps) means a cutoff, where two people no longer speak.
Structural lines tell you who is who. Emotional bond lines tell you what is going on between them. That distinction is the key to reading any genogram.
Questions to explore:
- Which relationships are close, and which are in conflict?
- Are there any cutoff relationships?
- Do the emotional bonds follow a pattern, or is each relationship different?
- Which relationships in this family provide stability?
How generations are arranged
A genogram is organized in rows. Each row is one generation. The oldest generation sits at the top, their children below, grandchildren below that. This top-to-bottom layout shows how a family has changed over time.
Within each row, siblings go left to right from oldest to youngest. You can compare siblings by looking across a row and trace patterns through generations by looking down.
Three generations is the standard. It provides enough depth to spot repeating patterns. If a grandparent had heart disease and a grandchild has the same condition, three generations makes that connection visible. Two generations would miss it.
Questions to explore:
- How many generations are shown?
- What differences do you notice between the generations?
- Are there any patterns that appear in more than one generation?
- Has any pattern improved from one generation to the next?
What health conditions look like on a genogram
Genograms track physical and mental health conditions with color-coded fills on each person's symbol. The colors are customizable per condition. When multiple family members share the same condition, the visual clustering makes the pattern obvious.
A patient's medical chart shows one person's health history. A genogram shows the entire family's health history on one page. If heart disease appears in a grandparent, a parent, and an uncle, the genogram surfaces that clustering. Individual charts never connect those dots because each record is separate.
Mental health conditions work the same way. Depression, anxiety, addiction, and other behavioral health conditions appear as color-coded fills, just like physical ones. When these conditions cluster in a family, it raises questions about hereditary risk, shared environmental factors, or relational patterns that contribute to distress.
Questions to explore:
- Which health conditions appear in this family?
- Do any conditions appear in more than one generation?
- Are conditions clustered on one side of the family or spread across both?
- Which family members have stayed healthy despite risk factors, and what might account for that?
Why this matters outside a clinical setting
Genograms are clinical tools, but the information they capture matters to everyone. Understanding your family's health patterns helps you make informed decisions about screenings and prevention. Understanding your family's emotional patterns helps you recognize dynamics you may be repeating.
Students encounter genograms in nursing, social work, psychology, and counseling programs. Anyone researching family history can add a genogram layer to their family tree. People in therapy build genograms with their therapist as part of assessment. The genogram does not diagnose anyone. It maps patterns and prompts questions.
Questions to explore:
- What is one pattern in your own family that a genogram could show?
- Has your doctor asked about family health history? Would a genogram make that conversation easier?
- What would you want to know about your family that a genogram could show?
- What coping strategies have worked for your family before?
How to build this in Genogram Pro
Start with yourself
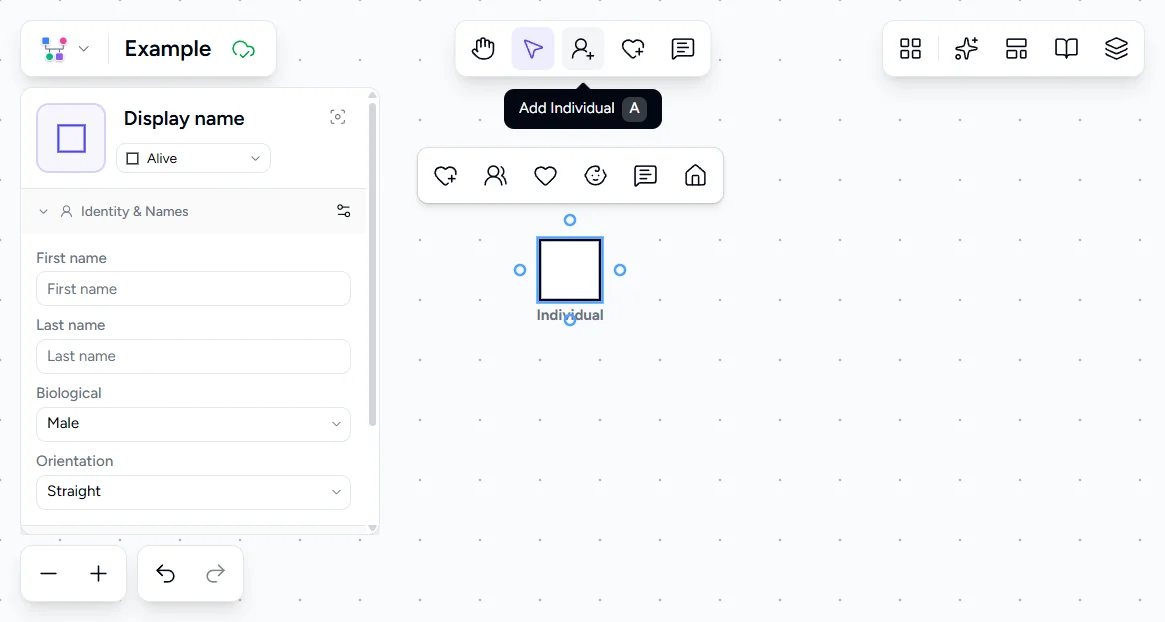
Click the canvas and place your own shape (square for male, circle for female). This is your starting point. If you are building a genogram of a client, start with their shape.
Add your partner or parents
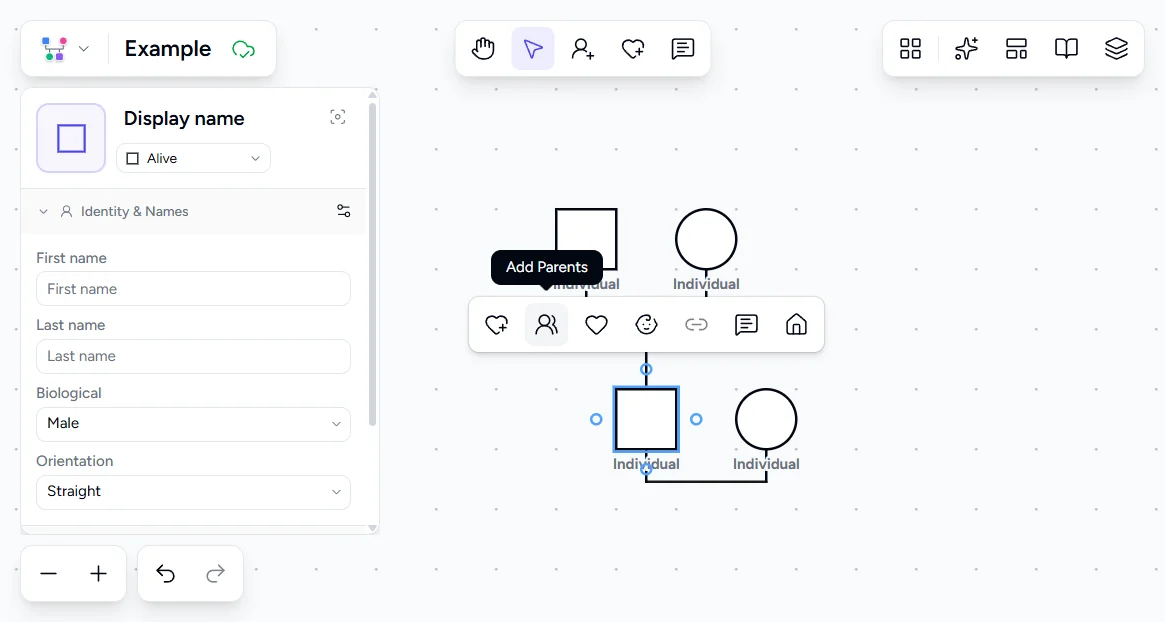
Select yourself and click Add Partner in the selection toolbar that appears above your symbol. Then add your parents in the row above. Parents appear above, partners beside.
Add siblings and children
Add brothers and sisters in your generation row. Add children below. Each person appears in the correct position based on birth order.

Add health conditions
Select any person and add medical or mental health conditions from the preset list (Cardiovascular, Cancer, Depression, Anxiety, and others) or add a custom condition. These appear as color-coded fills on the person's symbol.

Add emotional bond lines
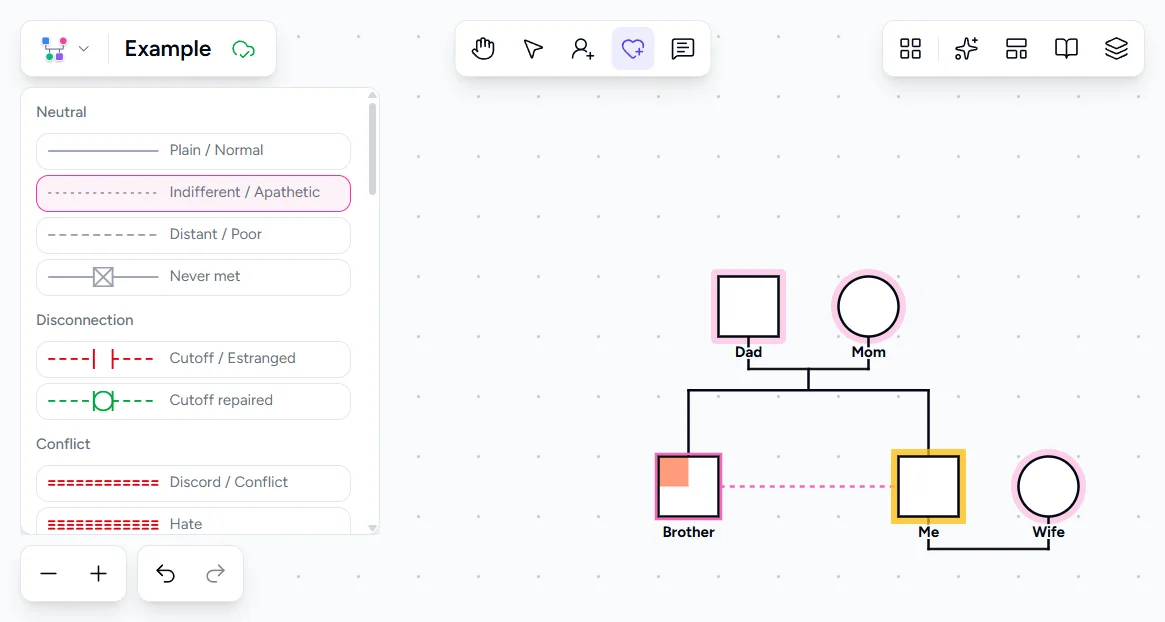
Select a person, then click Emotional Bond in the selection toolbar above them. Click the target person. A bond type picker appears where you choose the type: close, distant, discord, cutoff, and many more. These lines are what turn a family tree into a genogram.
Clinical context
Monica McGoldrick and Randy Gerson developed genograms in the 1980s to visualize family systems. Their work built on Murray Bowen's family systems theory, which proposed that emotional patterns pass through families across generations. The genogram gave Bowen's theory a visual language.
Today, genograms are used across healthcare, mental health, education, and social services. Nursing programs teach genograms as part of health history assessment. Family therapy training programs use them as a core clinical tool. Social workers use them to map support systems and identify risk factors. The standardized symbols (squares, circles, lines, and bond types) let any trained clinician read a genogram built by another.
A genogram generates hypotheses for further exploration, not conclusions. McGoldrick writes that it "cannot be used in a cookbook fashion to make clinical predictions." The patterns it surfaces are starting points for inquiry, not definitive answers.
Once you know that squares are male, circles are female, and X means deceased, you can read any genogram without looking up symbols. The shapes are people. The lines are relationships. The color-coded fills are health conditions. Clinical interpretation, pattern recognition, and treatment implications all build on that foundation.
Frequently Asked Questions
What is a genogram in simple terms?
Do I need special training to read a genogram?
What is the difference between a genogram and a family tree?
Can I build a genogram of my own family?
Ready to Create Your Own Genogram?
Build professional genograms online with standard notation, AI-powered generation, and end-to-end encryption.